Subscribe Now

Monday, November 30, 2009

Distribution keeps ongoing...

Just as the title says, the sharks in the ocean are distributing the hot potato to the little fish.

Let me be blunt, topping processes do take more time than bottoms actually. While bottoms can happen in a spike or so, tops usually don't. The reason is people tend to pertain on hope, so while there is still hope from the intervenients there is a struggle in the prices.

What I see in most indexes is actually topping patterns. Let's make a quick summary of the world's indexes.

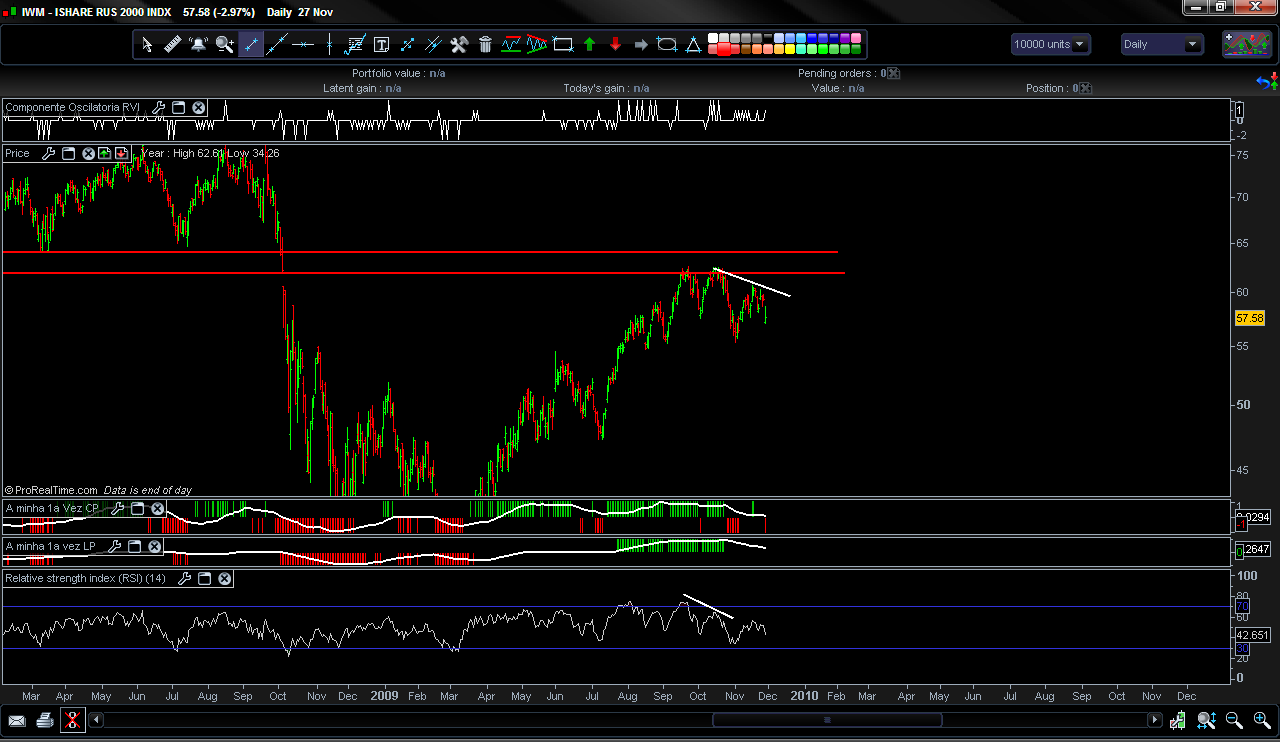
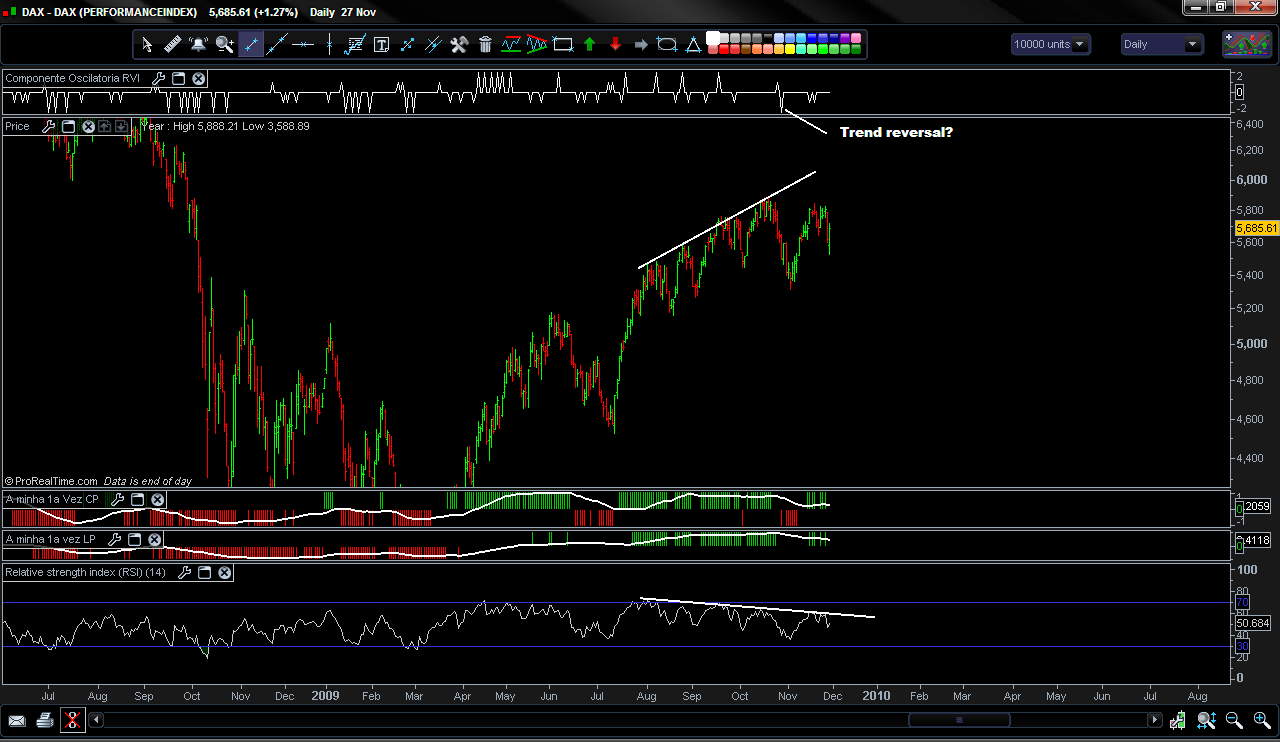
Pretty much all indexes remain lower than their highs from October. This stands true for ALL indexes except for S&P, Nasdaq and Dow Jones Industrials. Every other index is making lower highs and lower lows now.


This stands true for Russell 2000 and Dow Jones Transportation. Take special attention to the major divergences going on, especially in the indices that still haven't activated them (NQ, SP and DJI).

If we take a little road trip around the world, we'll see the same things as Russell and DJT. From Europe to Asia all indicates the same:


The curious thing is, the index that carried both S&P and NQ to new highs was the DJI. Remember in October when we had that strong sell off, and the DJI was able to maintain strong during the drop? Well now, the DJI is way higher than it's high in October while both SP and NQ are pretty much in tandem with that October high. Curious thing is while DJI was making highs after highs, 75% of the 30 components that make up the Dow Jones Industrials are (guess what?) still below their October highs ! Can we say big big divergence? You can figure it out why this is the case... the Dow calculation is something utterly stupid (the companies that have more weight in the index are the ones that have higher share prices instead of their total value...go figure).

Cheers

P.S.: Don't forget to have a look at http://friendly-traders.blogspot.com/ ... there's a nice database of programs there :-)

Saturday, November 28, 2009

Your dear beloved is back...

Hail to the king, for I am back. :-D

Finally! This week I didn't do any update, what a shame... Probably it may have missed to some of you, but last Sunday I got through the hospital and was diagnosed with H1N1 flu. Nothing to worry about, it's just a mere normal flu, oh but the headaches, those sure were a pain in the ass to go through. And probably the major reason why I didn't feel like looking at monitors, computers, etc.

Well I am back, fresh as a fresh salad and I will be posting lots of good stuff this weekend.

For appetizers, here's a website with lots of resources from trading programs, books, webinars, seminars, software management, software testing, etc.

The blog belongs to the former owner of www.friendly-traders.com which was a great website. Feel free to have a look overthere. The link is: http://friendly-traders.blogspot.com/

I will now begin working on tomorrow's post. It will be a whole new level of mathurbation of graphs and other things

Cheers and have a nice weekend...at least what's left of it.

Monday, November 23, 2009

Update

I'm sorry to everyone but I won't be delivering the update I promised. I have major headache and I don't feel like thinking much, and overheating this special brain of mine eheheh... :-D

I know in the end, swine or no swine flu, that little bastard will be a pig on a stick, señor


A pig on a stiiiiick....

Swine What?


Indeed... Your beloved host is the latest victim from those piggy bastards. Hence the lack of posting during this weekend. Last night I spent 5 very boring hours at the hospital only to arrive home at 2AM.

I will try to do a more thorough analysis throughout the day. You know where I stand, I think we are close to rolling over, and Ze' Manel already issued a sell signal. So far futures are ramping higher, but there's a nice little graph from Fujisan, a guest host from SOH, and she is very knowledgeable and I've learned a great deal from her posts. I found this graph very interesting.


It seems peaks have been happening at New Moon dates and bottoms around Full Moon dates. I'm not much into these kind of cycles, but I know new/full moon cycles have a very good hit rate in statistic terms, so I guess there may be something going on there...

Friday, November 20, 2009

Rolling over?

S&P rolling over?

 For the first time since the bottom at 1030's a few weeks back, we now have a sell signal. Let's see how this one develops.

Meanwhile the dollar is strengthening. Today there was a glitch shooting the USD Index up almost 10%. I wished it were true I'd be up like 200% in a blink of an eye eheheh...
Anyways, here too the bottom seems to be rolling up.

A lot of divergences going on, extreme bearishness from the public and market participants, and also the EW count calls for a move up. As you know I am expecting a big rally for USD, maybe as strong as +50% on the Index.


Of course, although I'm very bullish on the dollar I will only start buying once it passes through the 76 area or whenever I get a signal from my systems (which on the short term I already am long the dollar).

Monday, November 16, 2009

Weekend update

Not much to add after last week. We're still under the 1100 resistance area in the S&P500. In EW terms, I cannot make at this juncture a count.

There are times when we need to step back and wait a bit, for more information in order to make a correct assessment. Trying to force perspectives into our counts is foolish. One should know when to step back and admit that for now there's no need to try to come up with a count that has a low reliability.

To me, we're still in a topping process, especially with the recent market correlations that are kind of broken right now. I'm talking DAX and other european indexes, as well as the higher beta US indexes such as the Dow Transports and Russell 2000.

DJT is considered to be the leader of the market, and so far it has struggled and is still far away from its' highs. This week is utterly decisive.

As far as Ze Manel goes, well stay with the trend... this is an intraday chart:

These are the German DAX and the PSI-20 (the portuguese index)... both are more than lagging the current uptrend on the S&P and the DOW JONES.


 As far as the higher beta US indexes go, here's a snapshot of Russell 2000


Cheers!

P.S: I want to thank you for the adherence to EWI's free week. Definitely I wasn't expecting such a surge on participation. I hope you all took advantage of it and gathered some of their premium services. Don't worry, now that it's over you still have a lot of free stuff inside their members page, so to all of you that missed it you can still register and have access to their free stuff. And the free week from EWI is a common occurrence from them, so keep your eyes open.

Thursday, November 12, 2009

Chaos reign...

No I am not talking about the markets, but my home actually... Absolute chaos in here. Still very primitive, and so many things we need to place into the right spots... one room is still with renovations ongoing. Same goes for the kitchen. Furniture is pretty much all confined to the living room and that thing is worse walking around than an elephant at a porcelain shop !!

Well, moving on, I now have internet, may I say super dupper fast internet connection with fiber optic with a symmetric 150Mbps both download and upload... oh yeah.

Meanwhile the markets... although both DJI and S&P have risen to new highs, I see the market very weak. I think we're about to roll over.

While DJI and S&P made new highs, all higher beta indexes failed to do so. I'm talking Russell 2000, Banking Index, Dow Jones Transportation and so on... they are all within the 61.8 Fibonacci expected from a correction.

The european markets are also very weak and failed to make new highs. German DAX fell 10% during last week's decline from the highs to the bottom while S&P declined by 7%. So with this rally the DAX is still 5% away more or less from the highs while the S&P just made a new high today...

This kind of divergence among several markets usually happen at tops, meaning a lot of distribution is being made from strong hands to the weak ones.

It is my opinion we are near to roll over... supporting is once again the USD Index, which made new lows during this past week while the major pairs all failed to make new highs - i.e. EURUSD, GBPUSD, USDCAD (didn't make new lows).

So some pretty nasty broken market internals going on...

Now here's a chart, although I don't trade this time frame, it does indeed look promising, with a sell signal around the 1097 area:

Thursday, November 5, 2009

Update

I don't have a graph today...

Today's move fits yesterday's alternative, which from the graph I posted last night, where I had placed [2] it is wave (a) most likely... therefore this current run up is wave (c) within wave [2].

Also, I won't be able to be here tomorrow since my family and I are moving into a new house, so a lot is going on. I don't know also if I will be able to post the weekend post, I will try though but cannot promise anything...

If I am not able to come I wish you all good trades. See you Sunday (if I can).

Do not forget it's FreeWeek down at EWI.

You can check more here: http://www.mybullmarket.org/2009/11/blog-post.html

Wednesday, November 4, 2009

Wednesday FED'ish rubdown

I think today got more clear...
The following graph is what I think is most likely to happen. I forgot to put up the arrows of direction for those that don't understand EW, but if this is correct it means that tomorrow and into next week we should fall hard !

Today's little sell off into the close sure is yummy and may be a beginning, but I will look for more confirmation. Bears really need to show up here and take a stand.

 Ok this is what I have for today.

NOTE:
Also don't forget today EWI opened its' doors, so you might want to check them out... Today is an update day for them so they'll issue 12 page update which they do every Monday, Wednesday and Friday apart from the monthly newsletters. It's totally free, and you can always help this site (yes I get little commission, so at least you'd be helping me support the traffic costs and domain costs, not that I don't mind I do this for pleasure). If you do register please do so through one of the banners on the site or through here:

ELLIOTT WAVE 

Have a good night everyone...

EWI FreeWeek is here !!

Hello folks... EWI has opened its' doors. Freeweek is here.

You have access to the most recent newsletter where it is detailed on what is more likely we can expect from now on with the markets. Lot's of insight.

I am a subscriber myself, and although I can do my own EW analysis I am always anxious to get their newsletters in my mailbox. But you're wrong if you think they're all about EW. They're not. Be it TA or FA, there is always tremendous research going on in there, and one of the things I like most, is their psychology market analysis. Definitely worth the read.

Besides, it's free ! Just click the image below, register for EWI club (which it's free by the way, and just that entitles you to lots of free stuff outside the contents from FreeWeek, be it reports, tutorials, and so much more) and then you'll have access to this month's newsletter (120+ pages issued this weekend), as well the previous months' newsletters. There is also the Short term update, being a 3x weekly update of the markets - today is an issue day.

I think is a very good opportunity to see what kind of research they deliver, which in my opinion is outstanding. (and yes although I am an affiliate, I am saying this without any kind of bias, if I didn't agree I wouldn't subscribe to them myself).

So here's a sneak peak of what you get for free:
October 2009 Theorist | What's Inside?
14 eye-opening charts across 10 analysis-packed pages for today's most critical markets: U.S. stocks, gold and the U.S. dollar.
One chart you will NOT see elsewhere: It depicts a beautiful -- and telling -- fractal form in the past two years of market action.
Mounting evidence from trusted technical indicators: sentiment, advance/decline ratio and volume.
A decennial pattern in U.S. stocks that's held true for 10 of the past 11 decades.
An informative and useful section titled "Devising Trading Strategies."
Two and a half pages of gold analysis -- why lessons from the past likely provide ironies for the future.
Poignant analysis for the U.S. dollar.

November 2009 Financial Forecast | What's Inside?
Special Section: The November Financial Forecast includes an eye-opening special section on Goldman Sachs. These new insights about one of Wall Street's most storied firms have broad implications for Wall Street as a whole. You will see a picture of Goldman's history plotted along a 100-year chart of the Dow. You will also learn how the same sentiment driving the market today will drive the course of mega-deal makers in the future. This is a can't-miss special section.
Plus, you will get:
A thorough Elliott wave perspective on the stock market today -- what does Elliott tell us about the current juncture?
A telling bar pattern candlestick aficionados will recognize.
Valuable momentum considerations, including powerful evidence from a technical analysis method that tracks the distribution of stock from strong hands to weak.
A chart of dollar trading volume vs. GDP and the important analysis about it that you should see now.
And much more.

What's more, these are just two of the incredible free resources you get during this week only. You will also have completely free access to the most recent Theorist and Financial Forecast archives (September and October issues for each publication are currently available.) as well as the tri-weekly Short Term Update, which is designed to keep EWI's subscribers up to date between the monthly issues above.

Please don't delay. This special, limited-time offer from EWI is one of the most valuable free offers we've ever written to you about. It expires Nov. 11. Please follow the link below; sign up to join FreeWeek for free; print out your free reports; read them at your leisure. Do not miss this exciting opportunity.

Learn more about FreeWeek, and download your free reports here. 

So you got nothing to lose, click on an image or CLICK HERE


Tuesday, November 3, 2009

Mental brainiac tease

Wasn't today a bummer! I'll keep tonight's post very brief (really don't have much to say)

I don't have much perspective after today, the whole trading session was very messy, apart from the 1 min charts where some structures were very clear.

At this point, this is my best guess, a leading diagonal of the correction... either (a) of minute 2 is complete or this is only subwave 1 of (a).

Let's wait for a better view and then use it to our advantage.

This all feels very "wedgie" so we may undercut the bottom support, which is common on leading diagonals and continue up north our way into 1060's. Have a good night everyone...

Cheers everyone

Gapdown tomorrow....

Well, I missed the damn call for a sell off to the close today. In terms of wave structure it looks exactly the same.

It just hadn't much time to overcome my forecast, since structure is still in place I call for a gapdown tomorrow and continuation of the decline, at least until we make a new low under 1026. That may be the place, around the 1020's where a reversal can occur for a wave 2 rebound.

But going against the main trend is nuts, so my goal is not to find bottoms but tops so I can short the rallies. I don't intend to exit positions at possible bottoms in risk of losing the train.

I leave you the chart of today's close that served as forecast:

  Well, look at that !!

Australian Central Bank raised the rates by 25 basis points, nothing that we haven't foreseen.

Cheers!

Monday, November 2, 2009

Selling off into the close?

Just an idea across my mind...

It looks to me corrective this movement no?

Sunday, November 1, 2009

It's all about the dollar...

It's all about the dollar folks.

In my opinion the dollar seems to have bottomed, and that is the requirement for the indexes to start to decline as well. Patience is key most investors say. And the Dollar really tested my patience since July ! It's been surrounding the 77-75 levels for 5 months now almost, without any decisiveness on a turnaround.

Now, it seems very likely a bottom in the dollar has occurred and this will serve as a catalyst as well for the indexes to follow suit.

On the larger time frame, this is either a Wave C or the beginning of a 3rd Wave. For the mid-term projections it doesn't have any implications, the difference is, under Wave C this is just a rally under a larger degree bear market, with a 3rd Wave sky is really the limit, and for all I know, the index under a 3rd wave could really go to 120+ or something.

Here are the graphs regarding the USD:


 Regarding the indexes, this last move up was what is called under EW terms as a expanding ending diagonal.
According to the book Elliott Wave Principal it states that ending diagonals occur  when the previous move "has gone too far too fast". This surely fits into the current scenarios after a 65% rise in little under 7 months.

Nothing that couldn't be seen under EW as you can see here and here, whatever critics may say.

Again EWP states that near-term, diagonals are ending patters and they imply on thing which is "dramatic reversal". So one more argument for the bearish stance.

Here I lay some more charts:


 Not to mention, this last week the down days were very very big, achieving on Friday 95% of the volume was for the downside, with 10 stocks declining for each rising stock.

Also the German DAX, that most the times works as a "forecaster" has already declined 10% while S&P has declined 6% from the top, causing a market divergence, so I expect the S&P and the DOW to catch up with the DAX in brief order.

Also, take note at the above picture... 5 waves declining. Anyways I'm expecting in brief order some kind of bounce during the following days, maybe we open negative, catch support at 1020 and go to 1060-1070 for wave [2] (yellow box is the target)? That is, if indeed what we're seeing now isn't a 3rd wave extension. I guess we'll see...

Cheers ! (on a side note, how much do you want to bet the Australian Central Bank will raise interest rates this Tuesday? Either Tuesday or next month I bet it will raise the rates... so keep an eye on pairs related to AUD...)

Update:

Should I mention VIX?

Update 2:

Also VIX is on the 1st step of a buy signal for equities. Remember the steps in order for a valid signal:
- close outside the BB 2.0
- close back inside the BB 2.0
 - and a lower close that previous day

So this could support again the scenario of wave [1] being almost done, hence the rebound scenario expected.


Live Economic Calendar Powered by the Forex Trading Portal Forexpros.com
Disclaimer: The information provided on this website, while timely, colorful, and accurate, is not to be taken as financial, legal, tax, psychological or any type of advise. The purpose of this website is to track the progressions of human herd psychology as it is reflected through several financial markets. Any commentary on this page, however useful it may be, is used for illustration, and to inspire thought provoking discussion, and not to be taken as specific trade recommendations. We are not endorsing any site or service, nor are we promoting choice examples as real-life trades. If it sounds sarcastic, it probably is and if it offends you, just don't read it. There are tremendous inherent risks in attempting to trade any market using any vehicle, particularly if it is leverage. Please contact your broker to explain all risks involved in the vehicle you will be trading and any questions you may have.

Back to TOP